
Government Dietary Recommendations
Government recommendations for energy
and nutrients for males and females aged 1 –
18 years and 19+ years.
Government Dietary Recommendations
About Public Health England
Public Health England exists to protect and improve the nation's health and
wellbeing, and reduce health inequalities. It does this through world-class
science, knowledge and intelligence, advocacy, partnerships and the delivery
of specialist public health services. PHE is an operationally autonomous
executive agency of the Department of Health.
Public Health England
Wellington House
133-155 Waterloo Road
London SE1 8UG
Tel: 020 7654 8000
www.gov.uk/phe
Twitter: @PHE_uk
Facebook: www.facebook.com/PublicHealthEngland
Prepared by: Nutrition Science Team, Public Health England
© Crown copyright 2016
You may re-use this information (excluding logos) free of charge in any
format or medium, under the terms of the Open Government Licence v3.0. To
view this licence, visit OGL or email psi@nationalarchives.gsi.gov.uk. Where
we have identified any third party copyright information you will need to
obtain permission from the copyright holders concerned.
Published August, 2016
PHE publications gateway number: 2016202
2
Government Dietary Recommendations
Contents
Introduction 4
Table Index 5
Dietary Recommendation Tables 6
References 12
3
Government Dietary Recommendations
Introduction
This document provides a concise summary of the government’s recommendations
for energy and nutrients for males and females aged 1 – 18 years and 19+ years.
These are based on recommendations from the Committee on Medical Aspects of
Food Policy (COMA) and the Scientific Advisory Committee on Nutrition (SACN).
These recommendations relate to the general population. It is recommended that
anyone with a medical condition who is in search of dietary advice should consult
their GP or a registered dietitian.
Further information on the government’s healthy eating messages, which are based
on COMA and SACN recommendations, can be found at
https://www.gov.uk/government/publications/the-eatwell-guide.
4
Government Dietary Recommendations
Index to tables
Table 1 Government recommendations for energy, macronutrients, salt and dietary
fibre for males and females aged 1 – 18 years
Table 2 Government recommendations for energy, macronutrients, salt and dietary
fibre for males and females aged 19+ years
Table 3 Government recommendations for vitamins for males and females aged 1 – 18
years
Table 4 Government recommendations for vitamins for males and females aged 19+
years
Table 5 Government recommendations for minerals for males and females aged 1 – 18
years
Table 6 Government recommendations for minerals for males and females aged 19+
years
5
Government Dietary Recommendations
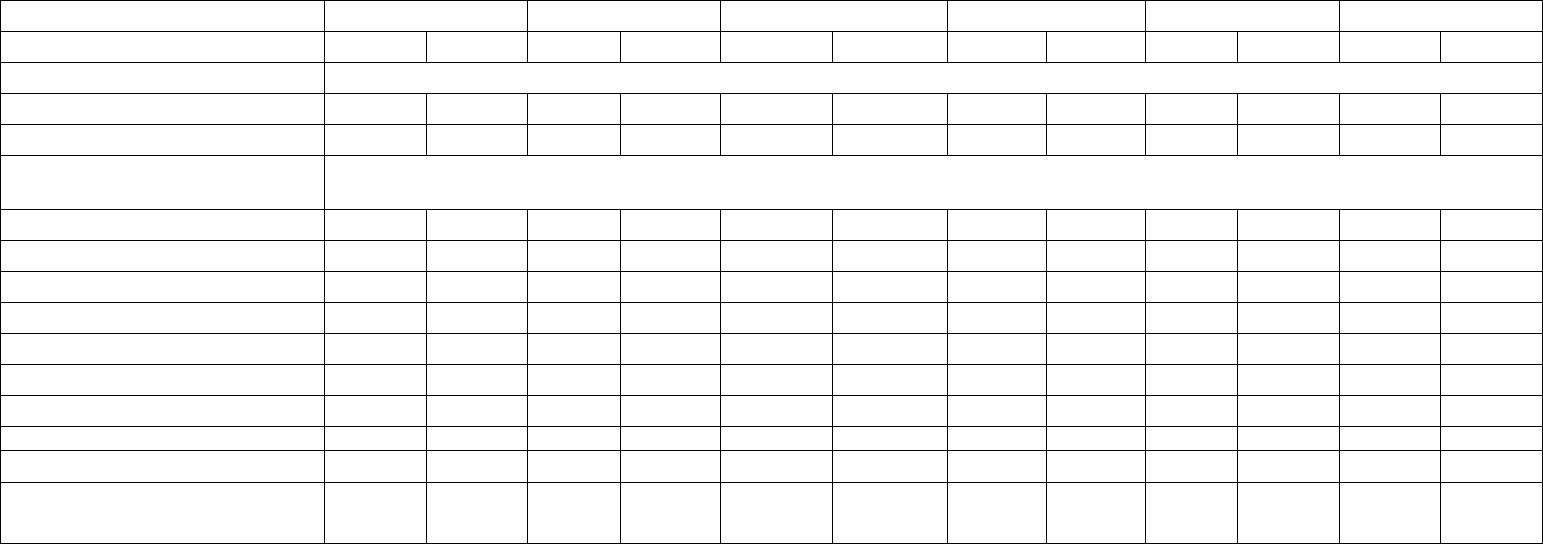
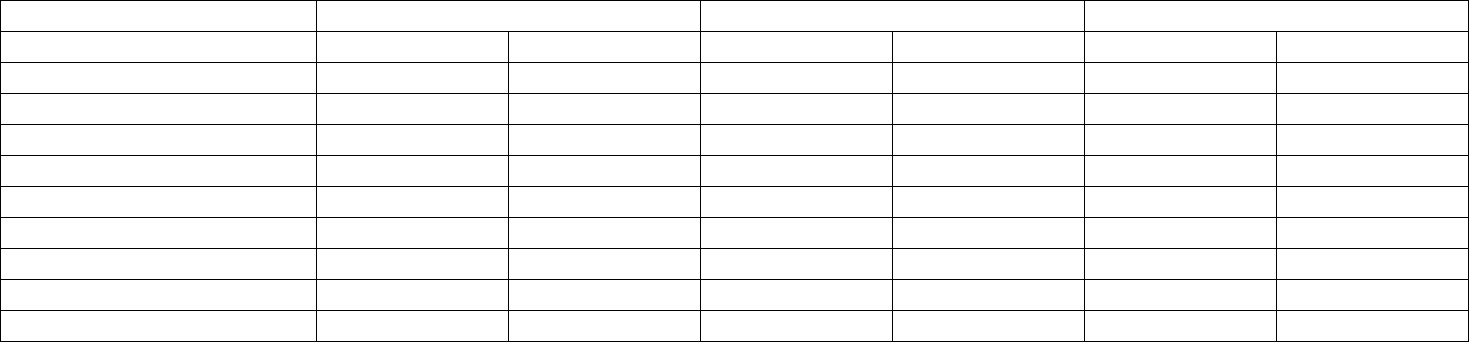
Table 1 Government recommendations for energy, macronutrients, salt and dietary fibre for males and females aged 1 -18 years
1
Age (years)
1
2 - 3
4 - 6
7 - 10
11 - 14
15 - 18
Gender
Males Females Males Females Males Females Males Females Males Females Males Females
Energy(MJ/day) 3.2 3.0 4.55 4.2 6.2 5.8 7.6 7.1 10.5 8.4 10.5 8.4
Energy (kcal/day) 765 717 1088 1004 1482 1378 1817 1703 2500 2000 2500 2000
Macronutrients
Protein (g/day) 14.5 14.5 14.5 14.5 19.7 19.7 28.3 28.3 42.1 41.2 55.2 45.0
Fat (g/day) [Less than] ― ― ― ― 58 54 71 66 97 78 97 78
Saturated fat (g/day) [Less than] ― ― ― ― 18 17 22 21 31 24 31 24
Polyunsaturated fat (g/day) ― ― ― ― 11 10 13 12 18 14 18 14
Monounsaturated fat (g/day) ― ― ― ― 21 20 26 25 36 29 36 29
Carbohydrate (g/day) [At least] ― ― 145 134 198 184 242 227 333 267 333 267
Free sugars (g/day) [Less than] ― ― 15 13 20 18 24 23 33 27 33 27
Salt (g/day) [Less than] 2.0 2.0 2.0 2.0 3.0 3.0 5.0 5.0 6.0 6.0 6.0 6.0
Fibre (g/day) ― ― 15 15
15 (4y)
20 (5-6y)
15 (4y)
20 (5-6y)
20 20 25 25 30 30
1
The figures in this table should be used in conjunction with the following information:
Energy figures were derived from SACN Dietary Reference Values for Energy (2011). Figures for all age groups, with the exception of one year olds were averaged
accordingly. Figures for 11 - 18 year olds have been capped at 10.5 MJ (2500kcal)/day for males and 8.4MJ (2000kcal)/day for females to help address issues of overweight
and obesity. The figures for energy in this table relate to the general population and individual requirements may vary.
Protein figures were obtained from Dietary Reference Values for Food Energy and Nutrients for the United Kingdom (1991).
Fat figures were calculated using the energy figures from SACN Dietary Reference Values for Energy (2011). The percentages for which to calculate grams per day of fat (35%
food energy); saturated fat (11% food energy); polyunsaturated fat (6.5% food energy) and monounsaturated fat (13% food energy) were obtained from Dietary Reference
Values for Food Energy and Nutrients for the United Kingdom (1991).
Carbohydrates figures were calculated using the energy figures from SACN Dietary Reference Values for Energy (2011). The percentage for which to calculate grams of
carbohydrate per day (50% total dietary energy) was obtained from SACN Carbohydrate and Health (2015).
Free sugars are any sugars added to food or drinks, or found naturally in honey, syrups and unsweetened fruit juices. The figures for free sugars were calculated using the
energy figures from SACN Dietary Reference Values for Energy (2011). The percentage for which to calculate grams of free sugars per day (5% food energy) was
recommended in SACN Carbohydrate and Health (2015). No recommendation was made for free sugars for those under 2 years of age.
Salt figures were obtained from SACN Salt and Health report (2003). These target salt intakes do not represent ideal or optimum consumption levels, but achievable population
goals.
Dietary fibre figures were obtained from SACN Carbohydrate and Health (2015). These figures are based on evidence in which the consumption of a variety of foods rich in
dietary fibre as a naturally integrated component is associated with beneficial health outcomes [SACN Carbohydrate and Health (2015)]. No recommendations were made for
children aged under 2 years, however it is recommended that from about six months of age, gradual diversification of the diet to provide increasing amounts of whole grains,
pulses, fruits and vegetables should be encouraged.
6
Government Dietary Recommendations
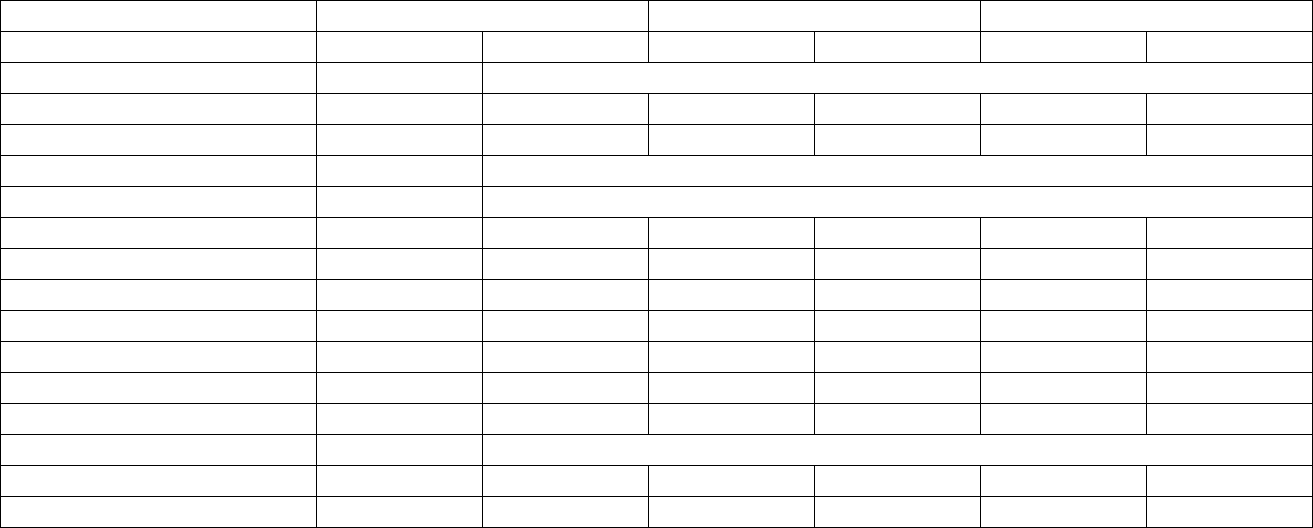
Table 2 Government recommendations for energy, macronutrients, salt and dietary fibre for males and females aged 19+ years
2
Age (years) 19 - 64 65 - 74 75+
Gender
Males
Females
Males
Females
Males
Females
Energy(MJ/day) 10.5 8.4 9.8 8.0 9.6 7.7
Energy (kcal/day) 2500 2000 2342 1912 2294 1840
Macronutrients
Protein (g/day)
55.5
45.0
53.3
46.5
53.3
46.5
Fat (g/day) [Less than] 97 78 91 74 89 72
Saturated fat (g/day) [Less than] 31 24 29 23 28 23
Polyunsaturated fat (g/day) 18 14 17 14 17 13
Monounsaturated fat (g/day) 36 29 34 28 33 27
Carbohydrate (g/day) [At least] 333 267 312 255 306 245
Free sugars (g/day) [Less than]
33
27
31
26
31
25
Salt (g/day) [Less than] 6.0 6.0 6.0 6.0 6.0 6.0
Dietary fibre (g/day) 30 30 30 30 30 30
2
The figures in this table should be used in conjunction with the following information:
Energy figures were derived from SACN Dietary Reference Values for Energy (2011). Figures for all age groups were averaged accordingly. Figures for 19 - 64 year olds have
been capped at 10.5 MJ (2500kcal)/day for males and 8.4MJ (2000kcal)/day for females to help address issues of overweight and obesity. The figures for energy in this table
relate to the general population and individual requirements may vary.
Protein figures were obtained from Dietary Reference Values for Food Energy and Nutrients for the United Kingdom (1991).
Fat figures were calculated using the energy figures from SACN Dietary Reference Values for Energy (2011). The percentages for which to calculate grams per day of fat (35%
food energy); saturated fat (11% food energy); polyunsaturated fat (6.5% food energy) and monounsaturated fat (13% food energy) were obtained from Dietary Reference
Values for Food Energy and Nutrients for the United Kingdom (1991).
Carbohydrate figures were calculated using the energy figures from SACN Dietary Reference Values for Energy (2011). The percentage for which to calculate grams of
carbohydrate per day (50% total dietary energy) was obtained from SACN Carbohydrate and Health (2015).
Free sugars are any sugars added to food or drinks, or found naturally in honey, syrups and unsweetened fruit juices. The figures for free sugars were calculated using the
energy figures from SACN Dietary Reference Values for Energy (2011). The percentage for which to calculate grams of free sugars per day (5% food energy) was
recommended in SACN Carbohydrate and Health (2015). No recommendation was made for free sugars for those under 2 years of age.
Salt figures were obtained from SACN Salt and Health (2003). These target salt intakes do not represent ideal or optimum consumpti
on levels, but achievable population goals.
Dietary fibre figures were obtained from SACN Carbohydrate and Health report (2015). These figures are based on evidence in which the consumption of a variety of foods
rich in dietary fibre as a naturally integrated component is associated with beneficial health outcomes [SACN Carbohydrate and Health (2015)]. No recommendations were
made for children aged under 2 years, however it is recommended that from about six months of age, gradual diversification of the diet to provide increasing amounts of whole
grains, pulses, fruits and vegetables should be encouraged.
7
Government Dietary Recommendations
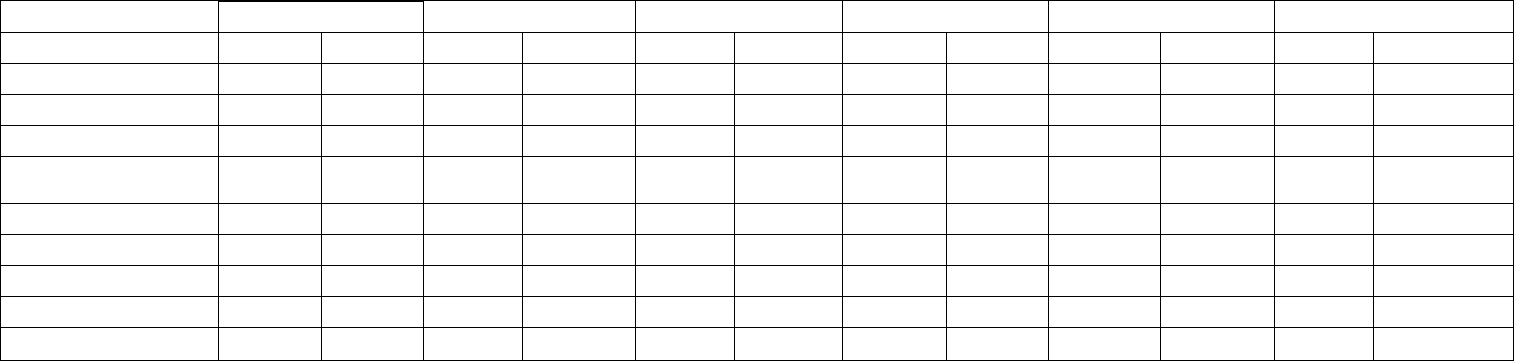
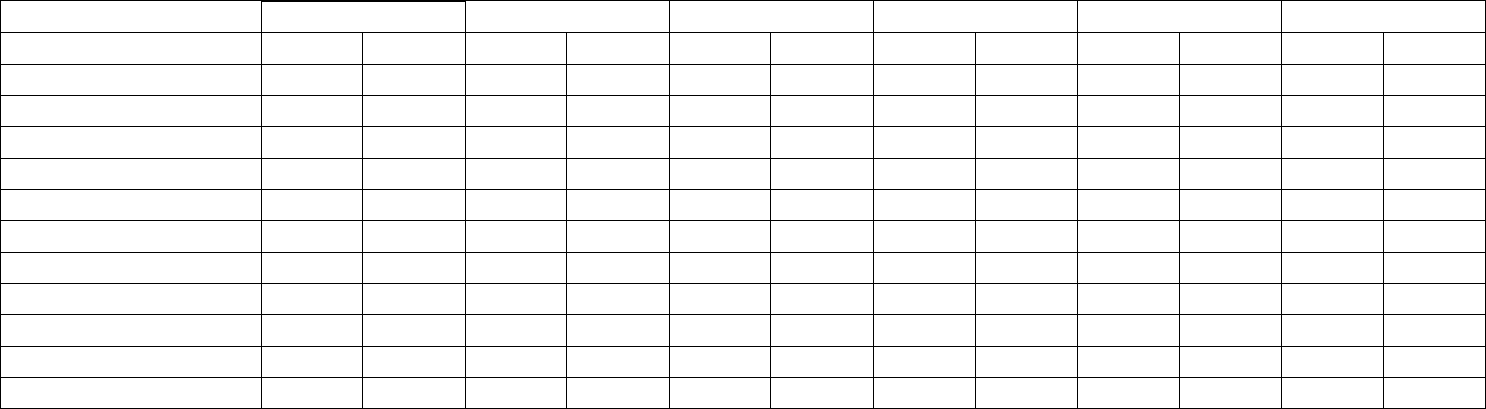
Table 3 Government recommendations for vitamins for males and females aged 1 – 18 years
3
Age (years)
1
2 - 3
4 - 6
7 - 10
11 - 14
15 - 18
Gender
Males Females Males Females Males Females Males Females Males Females Males Females
Vitamin A (µg/day)* 400 400 400 400 400 400 500 500 600 600 700 600
Thiamin (mg/day) 0.3 0.3 0.4 0.4 0.6 0.6 0.7 0.7 1.0 0.8 1.0 0.8
Riboflavin (mg/day) 0.6 0.6 0.6 0.6 0.8 0.8 1.0 1.0 1.2 1.1 1.3 1.1
Niacin equivalent
(mg/day)
5.0 4.7 7.2 6.6 9.8 9.1 12.0 11.2 16.5 13.2 16.5 13.2
Vitamin B
6
(mg/day) 0.7 0.7 0.7 0.7 0.9 0.9 1.0 1.0 1.2 1.0 1.5 1.2
Vitamin B
12
(µg/day) 0.5 0.5 0.5 0.5 0.8 0.8 1.0 1.0 1.2 1.2 1.5 1.5
Folate (µg/day)**
70
70
70
70
100
100
150
150
200
200
200
200
Vitamin C (mg/day)* 30 30 30 30 30 30 30 30 35 35 40 40
Vitamin D (µg/day)*** 10 10 10 10 10 10 10 10 10 10 10 10
3
The figures in this table should be used in conjunction with the following information:
Vitamin figures were obtained from Dietary Reference Values for Food Energy and Nutrients for the United Kingdom (1991) and from SACN Vitamin D and Health (2016).
Dietary Reference Values for certain nutrients are not available for children below the age of 5 years.
Niacin equivalent and thiamin figures were cacluated using the energy figures derived from SACN Dietary Reference Values for Energy (2011). Niacin equivalent = niacin +
(tryptophan divided by 60)
*Vitamins A and C: The government recommends that children aged from six months up to five years of age are given a vitamin supplement of vitamins A and C, often
provided in a combined supplement with vitamin D. This is a precautionary measure, to ensure that their requirements for these nutrients are met, at a time when it is difficult to
be certain that the diet provides a reliable source. Babies fed infant formula should not be given a vitamin supplement until they are receiving less than 500ml (about a pint) of
infant formula a day, because infant formula is fortified with certain nutrients, including vitamins A and C.
**Folate: it is recommended that women of child bearing age take a 400µg folic acid supplement daily until the 12th week of pregnancy. This is to help prevent birth defects of
the central nervous system, such as spina bifida, in your baby. If there is a family history of conditions like spina bifida (known as neural tube defects), a higher dose of 5mg of
folic acid each day may be needed until the 12th week of pregnancy. This is available on prescription from your GP. Women with diabetes and those taking anti-epileptic
medicines should speak to their GP for advice, as they may also need to take a higher dose of folic acid.
***Vitamin D: The Department of Health recommends that breastfed babies from birth to one year of age should be given a daily supplement containing 8.5 to 10µg of vitamin
D, to make sure they get enough. Babies fed infant formula should not be given a vitamin D supplement until they are receiving less than 500ml (about a pint) of infant formula
a day, because infant formula is fortified with vitamin D. Children aged 1 to 4 years old should be given a daily supplement containing 10µg of vitamin D.
As vitamin D is found only in a small number of foods, it might be difficult to get enough from foods that naturally contain vitamin D and/or fortified foods alone. So everyone,
including pregnant and breastfeeding women, should consider taking a daily supplement containing 10µg of vitamin D. Between late March/April to the end of September, the
majority of people aged five years and above will probably obtain sufficient vitamin D from sunlight when they are outdoors. So you might choose not to take a vitamin D
supplement during these months.
However, some groups of people will not get enough vitamin D from sunlight because they have very little or no sunshine exposure. So the Department of Health recommends
that people should take a daily supplement containing 10µg of vitamin D throughout the year if they are not often outdoors, such as those who are frail or housebound; are in an
institution such as a care home; usually wear clothes that cover up most of their skin when outdoors. People from minority ethnic groups with dark skin, such as those of
African, African-Caribbean or South Asian origin, might not get enough vitamin D from sunlight – so they should consider taking a daily supplement containing 10µg of vitamin D
throughout the year.
8
Government Dietary Recommendations
Table 4 Government recommendations for vitamins for males and females aged 19+ years
4
Age (years) 19 - 64 65 - 74 75+
Gender
Males
Females
Males
Females
Males
Females
Vitamin A (µg/day) 700 600 700 600 700 600
Thiamin (mg/day) 1.0 0.8 0.9 0.8 0.9 0.7
Riboflavin (mg/day) 1.3 1.1 1.3 1.1 1.3 1.1
Niacin equivalent (mg/day) 16.5 13.2 15.5 12.6 15.1 12.1
Vitamin B
6
(mg/day) 1.4 1.2 1.4 1.2 1.4 1.2
Vitamin B
12
(µg/day)
1.5
1.5
1.5
1.5
1.5
1.5
Folate (µg/day)* 200 200 200 200 200 200
Vitamin C (mg/day) 40 40 40 40 40 40
Vitamin D (µg/day)** 10 10 10 10 10 10
4
The figures in this table should be used in conjunction with the following information:
Vitamin figures were obtained from Dietary Reference Values for Food Energy and Nutrients for the United Kingdom (1991) and SACN Vitamin D and Health (2016)
.
Niacin equivalent and thiamin figures were cacluated using the energy figures derived from SACN Dietary Reference Values for Energy (2011). Niacin equivalent = niacin +
(tryptophan divided by 60)
*Folate: it is recommended that women of child bearing age take a 400µg folic acid supplement daily until the 12th week of pregnancy. This is to help prevent birth defects of
the central nervous system, such as spina bifida, in your baby. If there is a family history of conditions like spina bifida (known as neural tube defects), a higher dose of 5mg of
folic acid each day may be needed until the 12th week of pregnancy. This is available on prescription from your GP. Women with diabetes and those taking anti-epileptic
medicines should speak to their GP for advice, as they may also need to take a higher dose of folic acid.
*Vitamin D: As vitamin D is found only in a small number of foods, it might be difficult to get enough from foods that naturally contain vitamin D and/or fortified foods alone. So
everyone, including pregnant and breastfeeding women, should consider taking a daily supplement containing 10µg of vitamin D. Between late March/April to the end of
September, the majority of people aged five years and above will probably obtain sufficient vitamin D from sunlight when they are outdoors. So you might choose not to take a
vitamin D supplement during these months.
However, some groups of people will not get enough vitamin D from sunlight because they have very little or no sunshine exposure. So the Department of Health recommends
that people should take a daily supplement containing 10µg of vitamin D throughout the year if they are not often outdoors, such as those who are frail or housebound; are in an
institution such as a care home; usually wear clothes that cover up most of their skin when outdoors. People from minority ethnic groups with dark skin, such as those of
African, African-Caribbean or South Asian origin, might not get enough vitamin D from sunlight – so they should consider taking a daily supplement containing 10µg of vitamin D
throughout the year.
9
Government Dietary Recommendations
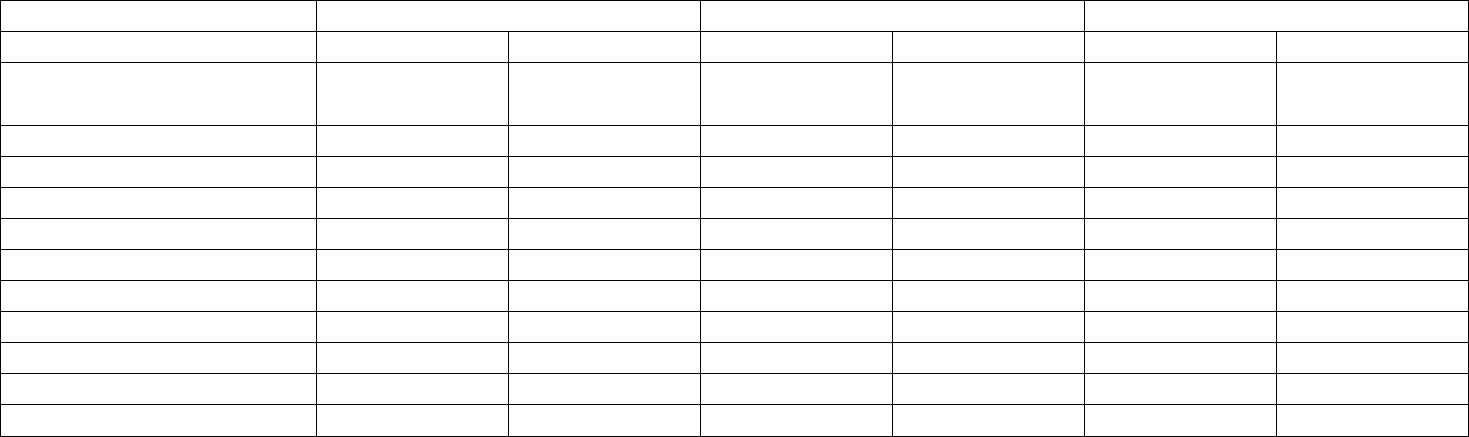
Table 5 Government recommendations for minerals for males and females aged 1 – 18 years
5
Age (years)
1
2 - 3
4 - 6
7 - 10
11 - 14
15 - 18
Gender
Males
Females
Males
Females
Males
Females
Males
Females
Males
Females
Males
Females
Iron (mg/day)
†
6.9 6.9 6.9 6.9 6.1 6.1 8.7 8.7 11.3 14.8 11.3 14.8
Calcium (mg/day)
350
350
350
350
450
450
550
550
1000
800
1000
800
Magnesium (mg/day) 85 85 85 85 120 120 200 200 280 280 300 300
Potassium (mg/day) 800 800 800 800 1100 1100 2000 2000 3100 3100 3500 3500
Zinc (mg/day) 5.0 5.0 5.0 5.0 6.5 6.5 7.0 7.0 9.0 9.0 9.5 7.0
Copper (mg/day) 0.4 0.4 0.4 0.4 0.6 0.6 0.7 0.7 0.8 0.8 1.0 1.0
Iodine (µg/day) 70 70 70 70 100 100 110 110 130 130 140 140
Selenium (µg/day) 15 15 15 15 20 20 30 30 45 45 70 60
Phosphorus (mg/day) 270 270 270 270 350 350 450 450 775 625 775 625
Chloride (mg/day) 800 800 800 800 1100 1100 1800 1800 2500 2500 2500 2500
Sodium (g/day)‡ 0.8 0.8 0.8 0.8 1.2 1.2 2.0 2.0 2.4 2.4 2.4 2.4
5
The figures in this table should be used in conjunction with the following information:
Mineral figures were obtained from Dietary Reference Values for Food Energy and Nutrients for the United Kingdom (1991). Dietary Reference Values for certain nutrients are
not available for children below the age of 5 years.
†
Iron: The figures for women aged 11 – 14 and 15 – 18 years may be insufficient for women with high menstrual losses where the most practical way of meeting iron
requirements is to take iron supplements.
‡Sodium: These figures were obtained from Dietary Reference Values for Food Energy and Nutrients for the United Kingdom (1991). Maximum salt recommendations for
achieveable population goals are presented in Table 1.
10
Government Dietary Recommendations
Table 6 Government recommendations for minerals for males and females aged 19+ years
6
Age (years) 19 - 64 65 - 74 75+
Gender
Males
Females
Males
Females
Males
Females
Iron (mg/d)
†
8.7
14.8(19-50y)
8.7 (50-64y)
8.7 8.7 8.7 8.7
Calcium (mg/day) 700 700 700 700 700 700
Magnesium (mg/day)
300
270
300
270
300
270
Potassium (mg/day) 3500 3500 3500 3500 3500 3500
Zinc (mg/day)
9.5
7.0
9.5
7.0
9.5
7.0
Copper (mg/day) 1.2 1.2 1.2 1.2 1.2 1.2
Iodine (µg/day)
140
140
140
140
140
140
Selenium (µg/day) 75 60 75 60 75 60
Phosphorus (mg/day)
550
550
550
550
550
550
Chloride (mg/day) 2500 2500 2500 2500 2500 2500
Sodium (g/day)‡ 2.4 2.4 2.4 2.4 2.4 2.4
6
The figures in this table should be used in conjunction with the following information:
Mineral figures were obtained from Dietary Reference Values for Food Energy and Nutrients for the United Kingdom (1991).
†
Iron: The figure for women aged 19 – 50 years may be insufficient for women with high menstrual losses where the most practical way of meeting iron requirements is to take
iron supplements.
‡Sodium: These figures were obtained from Dietary Reference Values for Food Energy and Nutrients for the United Kingdom (1991). Maximum salt recommendations for
achieveable population goals are presented in Table 2.
11
Government Dietary Recommendations
References
1. Scientific Advisory Committee on Nutrition (2011) Dietary Reference Values for Energy.
The Stationery Office. London. https://www.gov.uk/government/publications/sacn-
dietary-reference-values-for-energy
2. Scientific Advisory Committee on Nutrition (2015) Carbohydrates and Health. The
Stationery Office. London. https://www.gov.uk/government/publications/sacn-
carbohydrates-and-health-report
3. Committee on Medical Aspects of Food Policy (1991) Dietary Reference Values for Food
Energy and Nutrients for the United Kingdom. HMSO. London.
4. Scientific Advisory Committee on Nutrition (2003) Salt and Health. The Stationery Office.
London. https://www.gov.uk/government/publications/sacn-salt-and-health-report
5. Scientific Advisory Committee on Nutrition (2016) Vitamin D and Health. The Stationery
Office. https://www.gov.uk/government/publications/sacn-vitamin-d-and-health-report
12
